Production speed is one of the very first parameters that buyers examine while looking to evaluate a corrugator line. Nonetheless, the speed rating of a machine does not indicate the quantity of corrugated board that can be produced by a plant per day or month.
Actual output also depends on working width, effective running time, changeovers, downtime, and the types of board being produced. A more useful capacity calculation therefore starts with the machine’s basic output and then accounts for actual operating conditions.

How to Calculate Corrugator Production Capacity
The basic calculation is straightforward:
Theoretical Output (m²) = Machine Speed (m/min) × Working Width (m) × Production Time (min)
For example, a corrugator running at 200 m/min with a 2.5 m working width for 8 hours would have a theoretical output of:
200 × 2.5 × 480 = 240,000 m²/day
This figure assumes the machine runs continuously at the stated speed for the entire 8 hours. In actual production, this is rarely the case.
A more practical calculation considers effective operating time and production efficiency:
Actual Output = Machine Speed × Working Width × Effective Running Time × Operating Efficiency
For example:
| Parameter | Example |
| Machine speed | 200 m/min |
| Working width | 2.5 m |
| Scheduled production time | 8 hours |
| Effective running time | 7 hours |
| Operating efficiency | 90% |
The estimated actual output would be:
200 × 2.5 × 420 × 90% = 189,000 m²/day
If the factory operates for 26 days per month:
189,000 × 26 = 4,914,000 m²/month
This is a more useful figure for production planning because it accounts for the time the line is not actually producing board.
What Affects the Actual Output of a Corrugator?
Several factors can create a significant difference between theoretical and actual production.
Production Speed
A corrugator’s maximum rated speed is not necessarily its normal production speed. Actual operating speed may be reduced when producing certain board grades, flute profiles, or paper combinations.
A line that runs consistently at a slightly lower speed may produce more usable board than a faster line that requires frequent stops or adjustments.
Working Width
Working width directly affects output in square meters.
For example, at the same 200 m/min speed:
- 2.0 m width = 400 m²/min
- 2.5 m width = 500 m²/min
Therefore, working width should be considered together with machine speed when estimating capacity.
Changeover and Setup Time
Frequent changes between orders, flute profiles, paper grades, or board specifications reduce effective production time.
For factories with many small orders, changeover efficiency can have a greater impact on monthly output than a small increase in maximum machine speed.
Downtime and Maintenance
Any downtime due to equipment breakdowns, torn paper, adjustments, or maintenance will directly result in reduced time for production.
Preventive maintenance, replacement of old parts, and proper machine calibration may help in maintaining consistency in operating hours.
Effective Operating Time
The scheduled working time is not the same as production time.
If an 8-hour shift includes 30 minutes for setup, 20 minutes for paper changes, and 30 minutes of downtime, the line has only 6 hours 40 minutes of effective running time.
For capacity planning, using realistic operating data is therefore more reliable than simply multiplying the rated speed by shift hours.
Rated Capacity vs. Actual Production Capacity
The difference can be summarized as follows:
| Factor | Rated/Theoretical Capacity | Actual Capacity |
| Speed | Rated or maximum speed | Normal operating speed |
| Production time | Full scheduled time | Effective running time |
| Changeovers | Not included | Included |
| Downtime | Not included | Included |
| Operating efficiency | Assumed near 100% | Based on actual production |
| Production mix | Usually not considered | Considered |
This distinction is important when comparing corrugator lines.
For instance, an increase of the rated speed from 200 m/min to 220 m/min seems to result in a 10% gain in speed. However, if the increased speed entails more adjustments or works less efficiently, then the output gains would be much less.
For this reason, usable output is generally a better planning metric than maximum speed alone.
What to Consider When Estimating Corrugator Capacity for Your Factory
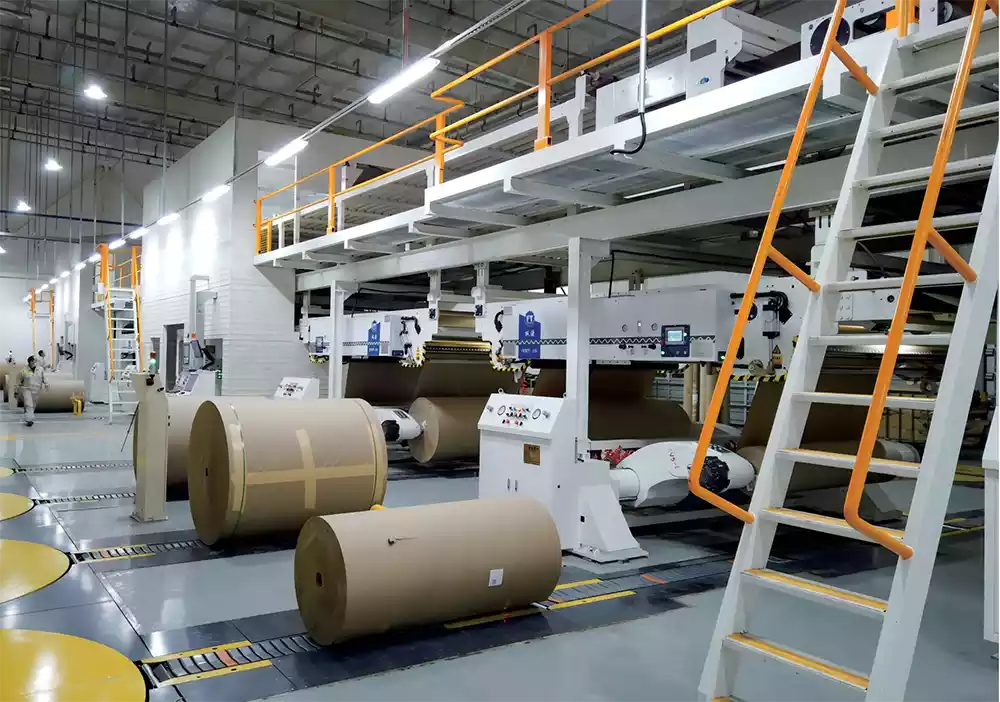
Capacity should be calculated from the factory’s actual production requirements rather than from a machine specification alone.
| Factor | What to Consider |
| Product mix | Average order sizes and board specifications |
| Flute profiles | B, C, E, F, or other profiles required |
| Working hours | Shifts per day and working days per month |
| Changeover frequency | Number of order or flute changes per shift |
| Production targets | Required daily or monthly board volume |
| Future expansion | Expected growth in orders and product range |
It is also useful to review historical production data when an existing line is being upgraded. Actual running speed, downtime, changeover time, and monthly output can provide a more realistic baseline than the original machine specifications.
For a new corrugator line, these figures can then be used to determine the appropriate working width, production speed, configuration, and level of automation.
The goal is not simply to select the fastest machine. A properly configured corrugator should provide enough capacity for current production requirements while maintaining stable operation and allowing room for future growth.